Please visit http://bit.ly/tiltondata and check it out! Please feel free to provide any feedback, or ideas for new reports and visualizations. You can find me on Twitter sharing additional resources @tiltondata.
Friday, November 22, 2019
Google Data Studio Report Catalog
I've been developing (and blogging about) Google Data Studio reports for Massachusetts schools for about a year now, and I realized it was becoming difficult to locate specific reports since they were embedded in blog posts. So I've created a searchable "report of reports" catalog with links, so now the individual reports are much easier to find!
Please visit http://bit.ly/tiltondata and check it out! Please feel free to provide any feedback, or ideas for new reports and visualizations. You can find me on Twitter sharing additional resources @tiltondata.
Please visit http://bit.ly/tiltondata and check it out! Please feel free to provide any feedback, or ideas for new reports and visualizations. You can find me on Twitter sharing additional resources @tiltondata.
Friday, November 8, 2019
School Attending Children Report - updated with 2019 data!
The School Attending Children report is submitted to MA DESE each February by each town's school department. Each town self-reports the enrollment of all full-time students whose parents or legal guardians are residents of the city or town (not just students for whom the district is financially responsible.) Categories include private and parochial schools, collaboratives, out-of-district public schools, home schooled, charter schools, and local public school districts (including regional and voc-tech districts).
DESE makes this data available online but it is challenging to look at the information longitudinally to understand how populations have changed over time. Google Data Studio can help! Click the image below to explore the data for any Massachusetts town.
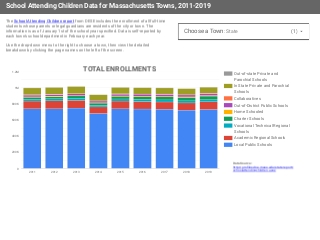
DESE makes this data available online but it is challenging to look at the information longitudinally to understand how populations have changed over time. Google Data Studio can help! Click the image below to explore the data for any Massachusetts town.
Friday, November 1, 2019
School Accountability Percentile Breakdown Report
If you've been digging in to the state accountability data for your district and school, you know that it's very complex and that there are a lot of numbers to look at! Each school receives an overall percentile (as well as subgroup percentiles) which measures the performance of students in a school (overall or in a subgroup) compared to other schools (or subgroups) in the state in one of three categories: high schools, non-high schools, and middle-high or K12 schools. These percentiles, from 1 to 99, are calculated using the percentiles of each of the individual accountability indicators for a school or subgroup through a complex weighting process. The percentiles piece of the accountability system is called the normative component of the system.
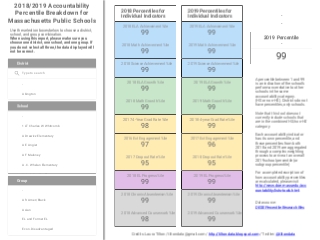
There is lots of accountability data available in School and District Profiles, but the percentiles available there are just overall percentile and subgroup percentiles. The individual percentiles of the accountability indicators (like ELA performance, graduation rate, chronic absenteeism, etc.) for a given school or subgroup are harder to find. But wouldn't it be nice to know WHICH of these indicator percentiles is particularly low or particularly high for your school?
I've created a new report in Google Data Studio which will allow you to easily explore this data (which DESE makes available as several very large public spreadsheets) for a given school and group. When using this report, please make sure you choose one district, one school, and one group. If you do not select all three, the data displayed may not be correct.
Friday, October 25, 2019
Holy Data Gamechanger! MassCUE, Conditional Formats, and More
I had the opportunity to present at the MassCUE conference this week (Harnessing the Power of Google Data Studio in Education) and was thrilled that the session was standing room only! Educators are hungry for simpler, more powerful ways to explore their data, and Data Studio is an amazing solution. My favorite Twitter response to the session? "Holy Data Gamechanger!" Pretty accurate, I'd say!
Speaking of gamechangers, this week Google added conditional formatting to Data Studio! Now we can color code tables or scorecards in Data Studio based on the value. Currently only 10 conditional formatting rules can be applied, so adding the same formatting to science in the same table right now isn't possible...hopefully this will be expanded in the near future.
Speaking of Twitter, I hope you'll follow me @tiltondata for resources and ideas related to data use to improve teaching and learning - Google Data Studio and beyond!
Tuesday, September 24, 2019
2019 Accountability Data Explorer
Massachusetts' school and district accountability data for 2019 is now public and available on the DESE Profiles site. Here's a new data visualization tool that allows a user to easily explore data for multiple schools and districts in one report. The report uses drop-down filters for district name, school name, school type, and classifications to narrow the data that is included in the report. Visit the Additional Information page in the report for ideas on how to make the most of these filters, including how you can share a link to a pre-filtered version of the report with colleagues.
The first page includes a simple table with basic accountability information, including a school's accountability percentile (the metric that compares a school with others) and its cumulative target percentage (the metric that compares a school with itself). The school name also links directly to the Profiles accountability page for that school. The second page visualizes this data through a scatter plot, where each dot on the plot represents a single school. Hover your mouse over the data points to see the school name!
For more information about Massachusetts' system for district and school accountability, please visit: http://www.doe.mass.edu/accountability/
I hope to update this report with additional data visualizations over time. Please share your ideas with me at tiltondata@gmail.com. If you'd like to receive blog updates via email, please sign up at https://k12madata.blogspot.com/
Thursday, January 17, 2019
Welcome!
Have you heard about Google Data Studio? Maybe it's just me and my data nerdiness, but I'm pretty excited about the potential for this tool to transform how schools access and analyze data. I'm starting to build some different reports and this blog will serve as a place to share them.
Subscribe to:
Posts (Atom)